

When sales activity becomes the target
What one B2B sales operation revealed about busy pipelines, unreliable data and the behaviour hiding behind the numbers
The review in brief
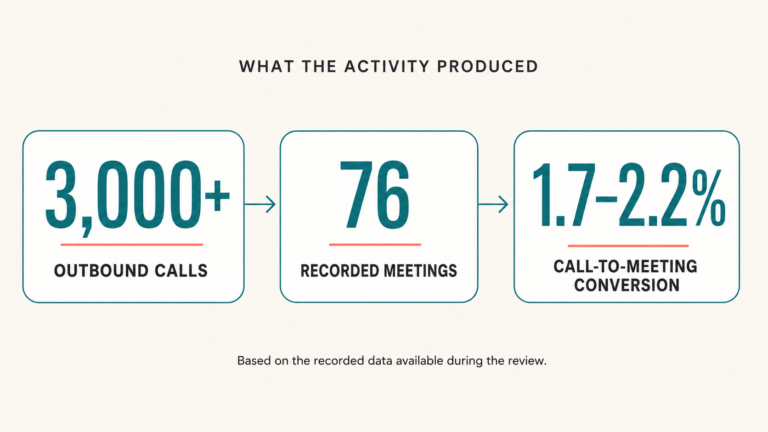
More than 3,000 calls generated 76 recorded meetings.
The visible call-to-meeting conversion rate was between 1.7% and 2.2%.
More than 1,000 lost opportunities had been recorded using 17 different loss reasons.
Opportunity creation increased by 46%, but conversion couldn’t be followed reliably through the systems.
The existing SDR model was subsequently discontinued.
More than 3,000 outbound calls.
76 meetings.
A recorded call-to-meeting conversion rate of between 1.7% and 2.2%.
The sales team of 25 was busy. The commercial return gave leadership a reason to look rather more closely.
These findings came from an anonymised commercial review I led within a multi-product B2B organisation. My remit covered group sales strategy, pipeline and team performance across a 25-person sales function selling software, professional services and digital products.
The business had separate teams selling software, professional services and digital products, supported by marketing, customer success and operational departments.
The organisation has been anonymised, and some figures have been rounded to protect commercial confidentiality. The analysis, recommendations and outcomes described here are based on internal sales reporting available during the review.
What we found raises a wider question for every sales leader:
Are you measuring progress towards revenue, or the activity that’s easiest to count?
The pipeline looked busy
The business had no shortage of visible commercial activity.
Salespeople were calling prospects, booking meetings and creating opportunities. Marketing campaigns were generating names and enquiries. Pipeline values were being reported to leadership.
A closer look found several problems beneath the headline numbers:
- Sales and marketing data sat across separate systems.
- Some customer journeys couldn’t be traced from initial enquiry to closed sale.
- Definitions of a lead weren’t consistently understood.
- Marketing activity and sales outcomes couldn’t always be connected.
- Lost opportunities had been recorded using overlapping reasons.
- Pipeline creation wasn’t consistently supported by evidence of buyer intent.
- Activity measures were clearer than commercial outcomes.
The dashboard contained plenty of numbers. It couldn’t answer some fairly basic questions about where revenue was coming from.
When the measure becomes the job
Sales leaders need leading indicators.
Revenue is delayed. Calls, emails, meetings and opportunities provide a quicker view of whether the team is doing something likely to produce it.
The trouble begins when the indicator becomes the objective.
Research describes a related behavioural phenomenon called surrogation. This happens when people begin treating a performance measure as though it were the underlying goal.
In sales:
- Call volume can stand in for prospecting quality.
- Meeting numbers can stand in for genuine buyer interest.
- Pipeline value can stand in for likely revenue.
- CRM completion can stand in for commercial control.
Experimental research has found that managers can lose sight of an underlying strategy when its measures become substitutes for it. The same research found that involving managers in choosing the strategy may help reduce this tendency. Read the strategy-surrogation research by Choi, Hecht and Tayler.
This research doesn’t prove that surrogation caused the results within the organisation I reviewed. It does offer a credible explanation for something many sales leaders will recognise: the team delivers the activity it’s asked to produce, while revenue continues to disappoint.
More than 3,000 calls produced 76 meetings
The organisation used an SDR-led outbound model designed to generate sales meetings.
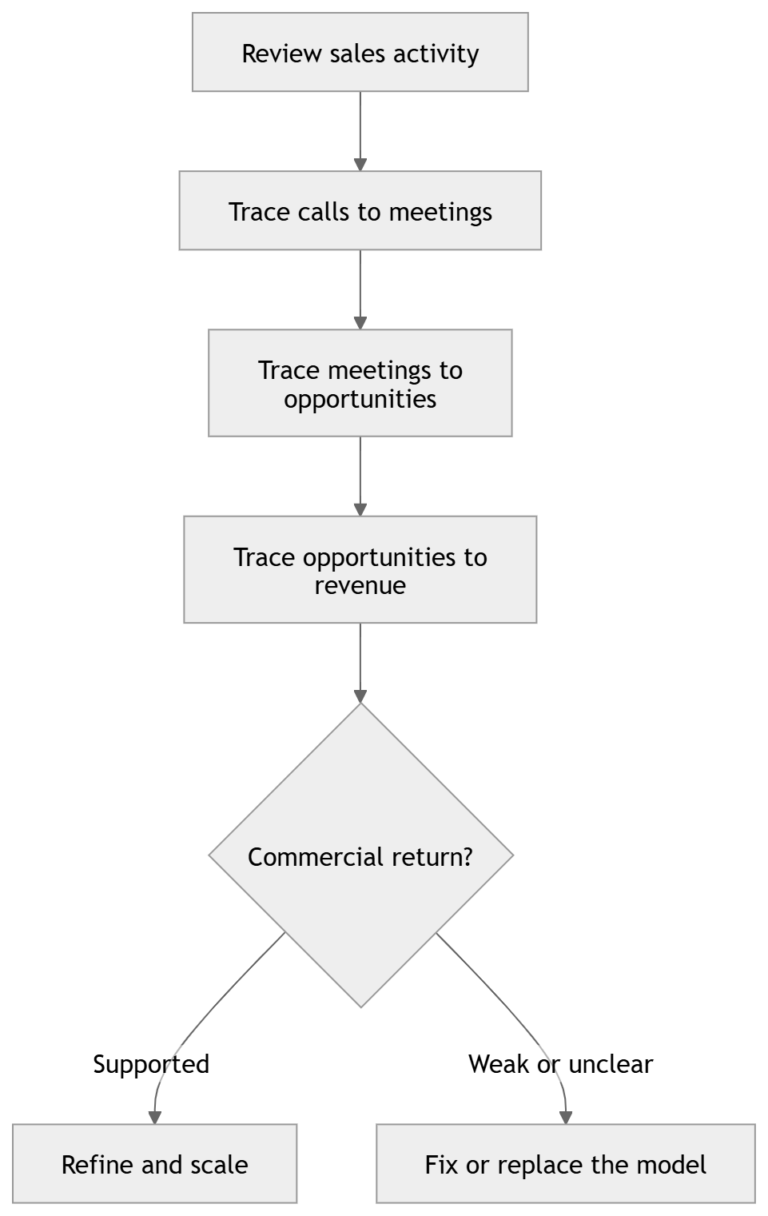
To understand its commercial value, I reviewed the available data from calls through to meetings and recorded sales.
The analysis found:
- More than 3,000 outbound calls
- 76 recorded meetings
- A call-to-meeting conversion rate between 1.7% and 2.2%
- Very limited attributable sales value visible within the available data
The systems couldn’t guarantee that every customer journey had been tracked through to sale. That limitation was made clear during the review.
The figures therefore represented the outcomes visible in the available data. They weren’t presented as proof that no other sales had occurred.
Even with that qualification, the evidence was strong enough to challenge continued confidence in the model.
The recommendation
For this particular company, based on who they were targeting, I recommended moving away from the existing SDR model.
The organisation subsequently decided to discontinue it.
That decision didn’t come from a general dislike of outbound sales. It came from examining what the activity appeared to produce.
More activity would have increased the call total. It wouldn’t necessarily have fixed:
- who was being targeted
- whether those buyers had a relevant need
- how the proposition was introduced
- whether the conversation created value
- how meetings were qualified
- what happened after the meeting
- whether the opportunity was likely to convert
Before asking a team to do more, sales leaders need to understand what the existing activity is producing.
More than 1,000 lost opportunities. Seventeen versions of why.
The outbound review was only one part of the diagnosis.
I also reviewed more than 1,000 recorded lost opportunities across 12 product areas. The data had been entered by 55 CRM users using 17 different loss reasons.
Several categories overlapped.
A lost sale might be recorded as:
- competitor
- existing supplier
- price
- no budget
- no response before a demonstration
- no response after a demonstration
- timing
- qualified out
- duplicate opportunity
Each label sounded reasonable in isolation. Collectively, they created ambiguity.
Was an “existing supplier” also a competitor?
Did “no response” mean the buyer had lost interest or had never been properly qualified?
Was “price” the real objection, or had the commercial value never become clear?
Should the opportunity have entered the pipeline at all?
Before asking the CRM for an answer, leadership had to establish whether everyone had been answering the same question.
CRM design influences sales behaviour
A CRM is often treated as a neutral container for sales data.
It isn’t.
The stages, fields, labels and required information all influence how salespeople record and progress opportunities.
Every ambiguous field requires another judgement. Every overlapping category makes inconsistent reporting more likely. Every unnecessary step creates friction. When salespeople are busy, the quickest available answer becomes understandably attractive.
The result can be a database that looks detailed while hiding considerable uncertainty.
My recommendations included:
- defining what counted as a lead
- distinguishing marketing-qualified and sales-qualified leads
- reducing ambiguity in opportunity stages
- reviewing overlapping loss reasons
- adding fields to improve lead-source tracking
- connecting marketing enquiries more reliably with sales outcomes
- requiring clearer evidence before opportunities progressed
- establishing greater ownership across each stage
This is behavioural design in practical form.
You’re making the desired behaviour clearer and easier to complete. You’re also making weak qualification and optimistic pipeline progression harder to hide.
Opportunity creation increased. Conversion still needed scrutiny.
The review didn’t find that everything was failing.
During the period examined, opportunity creation increased from 72 in one quarter to 105 at the equivalent point in the following quarter.
That was a recorded increase of 46%.
Internal reporting also recorded a 17% quarter-on-quarter increase in closed-won revenue.
Most of the growth in opportunity creation appeared to come from outbound work by the sales team. However, the evidence didn’t justify attributing the complete increase to one intervention or one person.
There was also a significant unanswered question:
Were the additional opportunities converting?
The business could demonstrate that more opportunities had been created. It couldn’t yet trace every opportunity confidently through to revenue or explain the eventual conversion pattern.
That distinction matters.
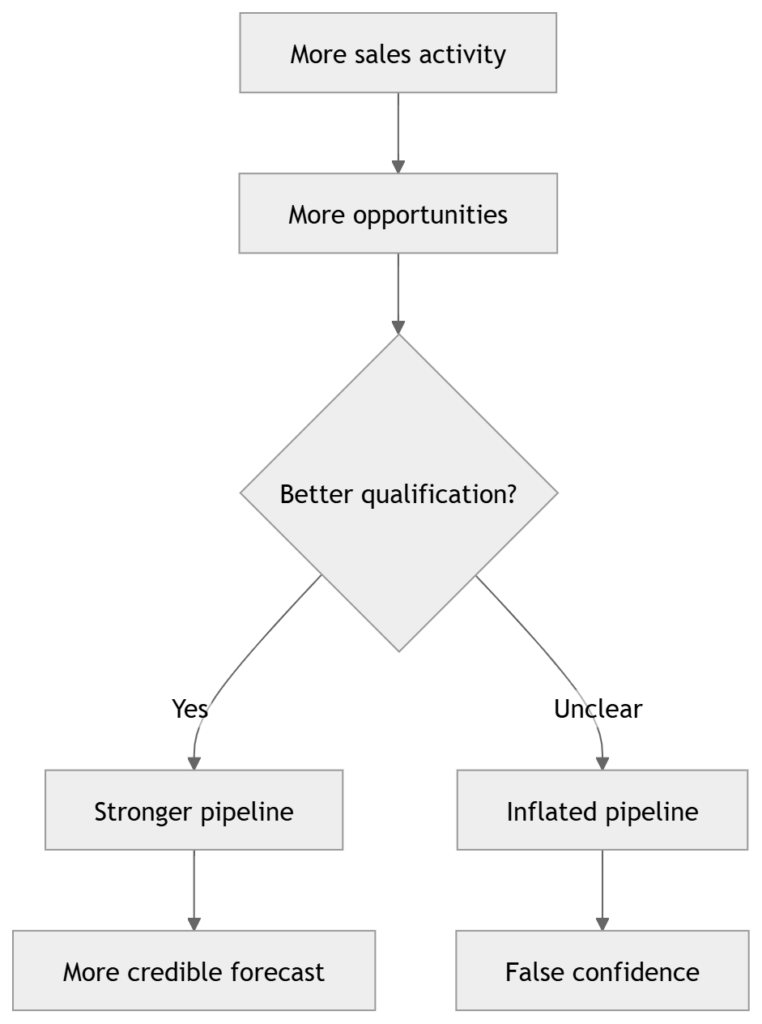
A larger pipeline can mean:
- more genuine demand
- improved prospecting
- better market coverage
- looser qualification
- opportunities being entered earlier
- stalled deals remaining open for longer
- more optimism being recorded as evidence
The increase was encouraging. It wasn’t permission to stop asking questions.
A 46% increase isn’t automatically a 46% improvement
This is another place where sales reporting can mislead.
Opportunity creation increased by 46%. Sales increased by 17% during one quarter.
Both figures were positive.
They were also measuring different things.
One described the volume entering the pipeline. The other described sales performance over a defined period. Neither, on its own, explained:
- whether opportunity quality improved
- which activity produced the sales
- how conversion changed
- whether sales cycles became shorter
- whether the improvement would continue
- which interventions contributed most
A responsible sales leader doesn’t dismiss positive data. They also don’t ask it to prove more than it can.
Current sales teams are under pressure to produce more pipeline
The problem extends beyond one organisation.
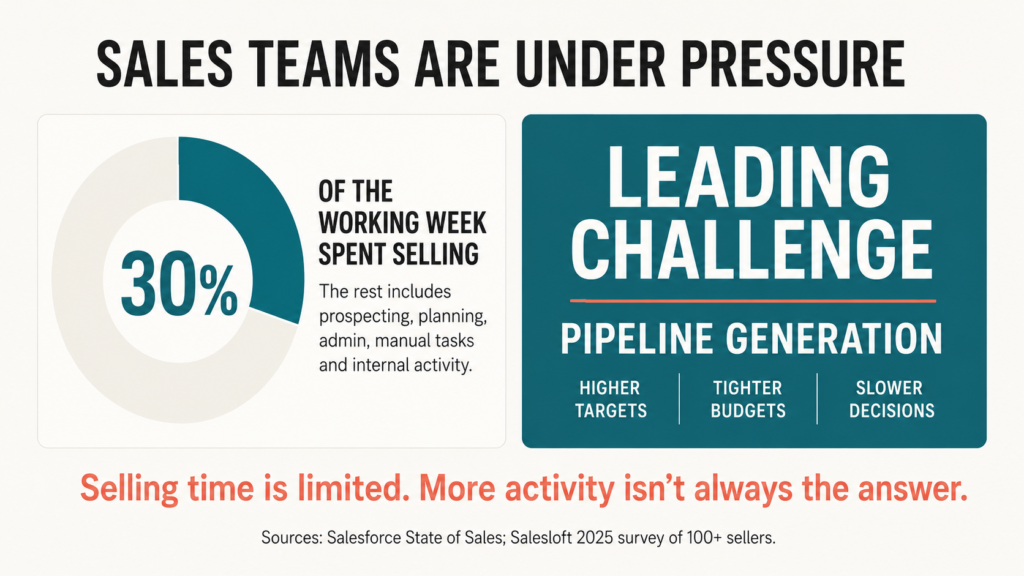
A 2025 Salesloft survey of more than 100 sellers described pipeline generation as the leading challenge facing sales leaders, alongside higher targets, tighter customer budgets and slower decisions. It’s a relatively small survey, so it should be treated as an indication of current sales pressure rather than a universal benchmark. See Salesloft’s 2025 pipeline-generation survey.
Salesforce’s State of Sales research found that salespeople spent around 30% of their average working week selling. The remaining time was spread across prospecting, planning, administration, manual tasks and internal activity. See the Salesforce State of Sales report.
Selling time is limited. That makes it even more important to understand which activity deserves it.
The answer can’t always be “more”.
Changing the behaviour behind the number
Once the diagnosis was clear, the next phase focused on how the sales operation worked day to day.
Recommendations and actions included:
- moving from reactive weekly activity to a longer-term sales strategy
- aligning sales priorities with customer buying cycles
- giving teams clearer product and customer targets
- introducing more consistent qualification
- developing practical sales scripts and conversation prompts
- creating objection-handling guidance
- building reusable email and follow-up sequences
- introducing structured prospecting and cross-sell training
- developing shared sales resources for existing staff and new starters
- improving coordination between sales and marketing
- creating a clearer rhythm for pipeline and performance reviews
The wider point is that more activity only helps when it sits inside the right strategy. These B2B sales strategies for inconsistent revenue look at where targeting, qualification, buyer progression and sales process need to work together.
Good intentions need a recognisable next action
Most sales expectations sound sensible:
- Qualify opportunities properly.
- Follow up quickly.
- Cross-sell where relevant.
- Keep the CRM updated.
- Focus on the right prospects.
The difficulty is that each instruction leaves the salesperson to decide what “properly”, “quickly”, “relevant” and “right” mean.
Behavioural scientist Peter Gollwitzer’s research into implementation intentions found that people are more likely to act when they connect a specific situation with a defined response.
The structure is simple:
When situation X occurs, I’ll take action Y.
The research suggests these plans can help people recognise the relevant cue and initiate the intended behaviour. Read Gollwitzer’s implementation-intentions research.
Applied to sales, that turns vague expectations into usable prompts:
| General expectation | Specific sales behaviour |
|---|---|
| Qualify the opportunity | When creating an opportunity, record the commercial problem, decision process and agreed next action |
| Follow up the meeting | When a meeting ends, agree the next step and enter its owner and date |
| Cross-sell appropriately | When a customer describes a related problem, ask the agreed diagnostic question before introducing another service |
| Keep the CRM accurate | When a deal changes stage, record the buyer evidence supporting the change |
| Follow up marketing interest | When a prospect demonstrates buying intent, trigger the relevant sales sequence within the agreed period |
The playbook doesn’t replace professional judgement.
It stops useful behaviour from depending entirely on memory, motivation or whether the salesperson has already survived six internal meetings that day.
More feedback doesn’t guarantee better sales performance
The organisation also needed a more useful rhythm of sales training and performance reviews.
It’s tempting to assume that more feedback will automatically improve results. The evidence is rather less comforting.
Kluger and DeNisi conducted a meta-analysis covering 607 effect sizes and 23,663 observations. Feedback improved performance on average, but more than one-third of the interventions reduced it.
Their research suggested that the effect depended partly on where feedback directed the recipient’s attention. Read Kluger and DeNisi’s feedback-intervention research.
That has a direct application to sales leadership.
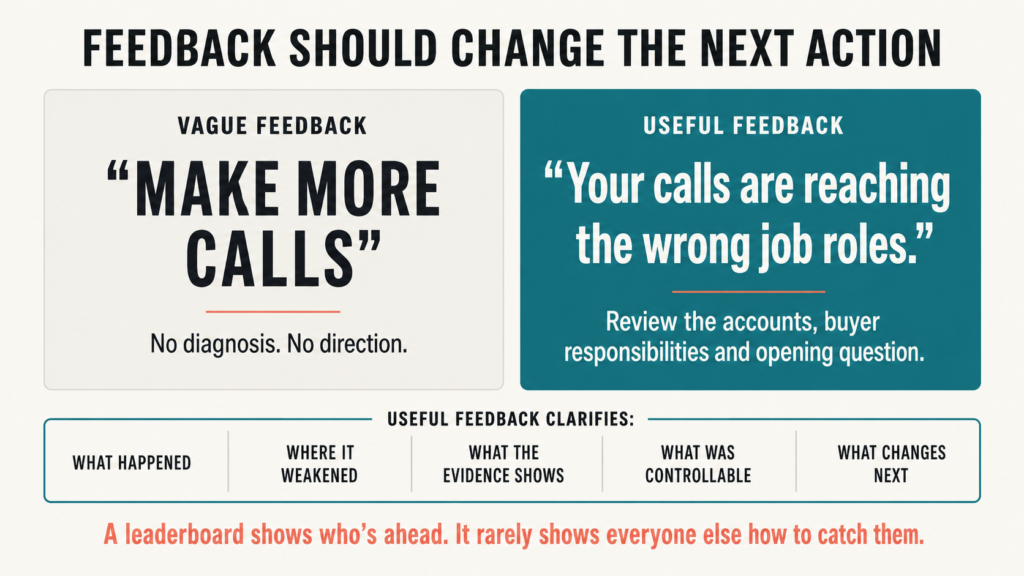
“Make more calls” is feedback.
So is:
Your calls are reaching the wrong job roles. Let’s review the accounts, buyer responsibilities and opening question before the next prospecting block.
The second version directs attention towards a problem the salesperson can examine and change.
Useful sales feedback should clarify:
- what happened
- where the opportunity weakened
- what the evidence shows
- what was within the salesperson’s control
- what action should change next
A leaderboard tells people who’s ahead. It rarely tells the rest of the team how to catch them.
The sales-leadership trap
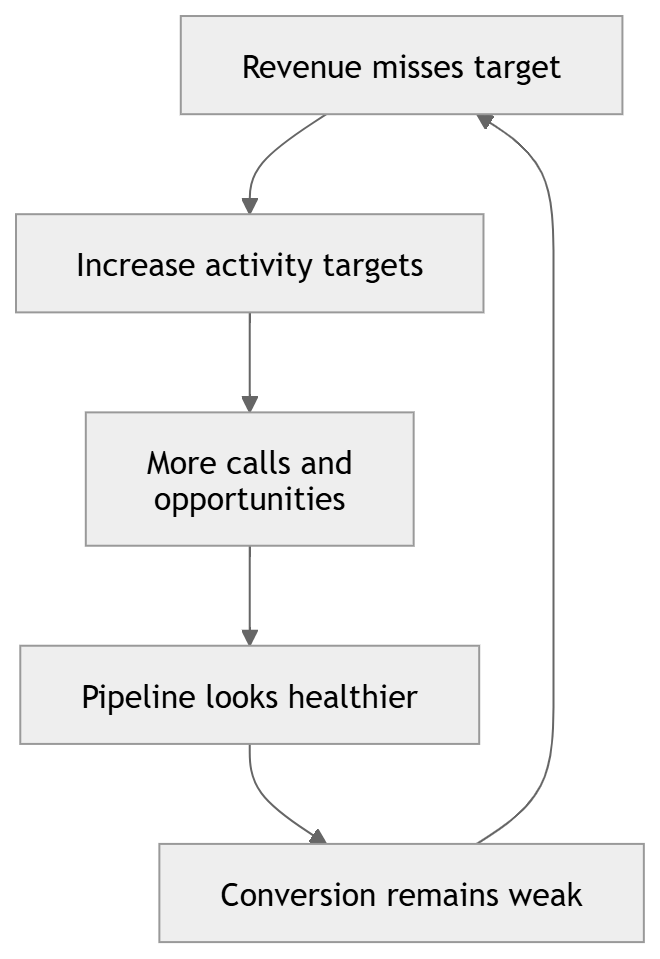
When revenue misses target, the instinctive response is often to increase the visible activity:
The loop continues because each increase in activity creates temporary reassurance.
There are more calls to report.
More meetings to discuss.
More opportunities in the CRM.
More pipeline to place in the forecast.
The underlying conversion problem remains.
Breaking the loop requires someone to examine the complete sales system:
- positioning
- targeting
- prospecting
- qualification
- pipeline quality
- messaging
- follow-up
- CRM behaviour
- deal progression
- conversion
- leadership rhythm
That’s the work of sales leadership. The spreadsheet is merely where some of the clues live.
Five questions every sales leader should ask
1. Which activity measures have become targets?
Look at what receives the most attention in meetings, dashboards, incentives and performance conversations.
That’s what the team will learn to prioritise.
2. Can activity be traced through to revenue?
Follow the chain:
Activity → conversation → qualified opportunity → proposal → sale
If the trail disappears halfway through, you don’t yet know which activity works.
3. What evidence allows a deal to enter or progress through the pipeline?
A salesperson’s confidence matters. Buyer evidence matters more.
4. Do CRM categories mean the same thing to everyone?
Ask five people to define a qualified lead, a committed opportunity and a lost deal.
The range of answers may explain more than the dashboard.
5. What should somebody do differently after the next review?
If the answer is simply “do more”, the diagnosis probably isn’t finished.
What this commercial review changed
The work produced several important outcomes:
- An underperforming outbound model was identified and discontinued.
- Sales activity was examined against its visible commercial return.
- More than 1,000 lost opportunities were analysed.
- Problems with CRM definitions and sales tracking were exposed.
- Sales and marketing handovers were challenged.
- Longer-term sales planning was recommended.
- Training began around prospecting and customer conversations.
- More specific sales prompts, resources and playbooks were developed.
- Pipeline growth was recognised without being mistaken for guaranteed revenue.
- Positive sales performance was reported alongside the limitations in attribution and tracking.
The work didn’t produce a neat claim that every problem had been solved.
It produced something more useful: a clearer commercial picture, better questions and decisions grounded in evidence.
Your sales team can work hard inside a system that works against them
Activity matters.
Calls need to be made. Meetings need to be created. Opportunities need to enter the pipeline.
Sales leadership has to examine what those activities produce and what behaviour the measures encourage.
Because every target teaches the team what matters.
Every CRM field influences what gets recorded.
Every pipeline review directs attention somewhere.
And every number becomes dangerous when it’s allowed to tell a bigger story than the evidence supports.
Find out what your sales activity is producing
Paula Bolton Consulting provides fractional sales leadership for B2B organisations that need greater control across pipeline, conversion, forecasting and team performance.
We examine the sales system behind the numbers, identify what’s weakening results and help put the changes into practice.
See where sales performance is being lost